


Quick answer
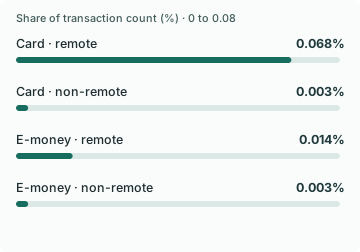
The EBA and ECB reported that 0.068% of remote card payments were fraudulent by count in 2024, compared with 0.003% of non-remote card payments. That is about 68 versus 3 per 100,000 payments using the published rates. By value, remote card fraud accounted for 0.091% of remote payments, versus 0.007% in the non-remote channel.
European Banking Authority and European Central Bank, 2025 report on payment fraud
Key findings and sources
Remote card payment fraud was about 68 per 100,000
For 2024, the EBA and ECB reported fraud in 0.068% of remote card payments and 0.003% of non-remote card payments by count. That is approximately 68 versus 3 per 100,000 within each channel, a difference of 65.
European Banking Authority and European Central Bank, 2025 report on payment fraud
2024 card transactions in EU/EEA payment-provider reports. Remote includes but extends beyond web checkout. Multiply each reported percentage by 1,000, then subtract.
Remote card fraud represented a larger share of value than of payments
Using the EBA and ECB’s rounded 2024 remote card fraud rates, 0.091% by value divided by 0.068% by count implies that the average fraudulent remote card transaction was approximately 1.34 times the average remote card transaction value.
European Banking Authority and European Central Bank, 2025 report on payment fraud
Same 2024 remote card transaction population for both rates. Divide the fraud value rate by the fraud count rate to cancel the two fraud and payment denominators into mean values.
Remote payments accounted for most card fraud in the report
In the EBA and ECB’s 2024 figures, remote payments made up around 18% of all card transactions but around 83% of card fraud transactions. The difference between those two shares was approximately 65 percentage points.
European Banking Authority and European Central Bank, 2025 report on payment fraud
Counts of 2024 reported card payments and fraudulent card payments. The two shares have different denominators. Subtract remote share of all card payments from remote share of fraudulent card payments.
The SCA share was 24 points higher by value than by count
The EBA and ECB reported that strong customer authentication applied to around 64% of electronically initiated card payment value and 40% of the count in 2024. The difference was about 24 percentage points.
European Banking Authority and European Central Bank, 2025 report on payment fraud
EU/EEA-issued cards, electronically initiated payments, including physical-point-of-sale payments. Subtract the reported share of count from the share of value.
Compare the results
The card benchmark changes when the channel changes
European payment providers report a single overall card fraud rate of 0.033% by value. That average includes physical and remote payments. The remote figure was 0.091%, almost 2.8 times the overall figure. Remote transactions represented around 18% of card payments by count but around 83% of fraudulent card payments. If a retailer compares a web checkout with a blended card benchmark, the composition of that benchmark can explain a large part of the apparent difference.
A DTC operator should start with its comparable payments. Use approved remote card transactions for the count rate and their value for the value rate, with a consistently defined transaction cohort and fraud reporting window. Keep regions and payment providers separate when their risk rules or reporting definitions differ. If you compare a web store with a pop-up shop, report each channel’s baseline before judging the team or the payment provider.
A fraud count and a fraud amount answer different questions
At the published remote card rates, about 68 transactions per 100,000 were reported as fraudulent and fraud accounted for 0.091% of payment value. Divide the value rate by the count rate and the rounded data imply an average fraudulent payment about 1.34 times the value of the average remote card payment. A team that sees its count rate stay steady while the value rate rises should check whether larger orders are driving the change.
The method also helps a team decide when a headline should stay in the footnotes. Remote e-money had a reported count rate of 0.014%, below the remote card rate by about 54 per 100,000. These populations differ. The result supports maintaining a benchmark for each instrument. A team would need its own matched data before claiming that shifting a shopper from card to e-money lowers fraud or raises completed sales. If you see a change after introducing a wallet, compare equivalent order values, markets and shopper cohorts before interpreting the result. Give fraud reports enough time to arrive before closing the comparison.
Find the payment state before helping the buyer
Track challenge starts, challenge completions, issuer approvals, completed orders and confirmed fraud as separate events. The European report puts strong customer authentication at 64% of card payment value but 40% of payment count across electronically initiated cards. If a store uses that 40% as a target challenge rate, it mixes a reported payment outcome with a checkout event and includes a large physical payment population.
Use a payment provider’s latest verified status before following up on a checkout. If a buyer completed a bank challenge but the order confirmation is delayed, reconcile the existing payment with the order record before asking them to pay again. If a payment is definitively closed and the buyer still wants the order, direct them to the secure checkout and give them the options actually available there. An unresolved status or an order already paid calls for support and reconciliation.
Study data
| Measure | Value | Context |
|---|---|---|
| Remote card fraud by value | 0.091% | Remote card fraud by value |
| Non-remote card fraud by value | 0.007% | Non-remote card fraud by value |
| Remote card fraud by transaction count | 0.068% | Remote card fraud by transaction count |
| Non-remote card fraud by transaction count | 0.003% | Non-remote card fraud by transaction count |
| Remote e-money fraud by value | 0.02% | Remote e-money fraud by value |
| Non-remote e-money fraud by value | 0.006% | Non-remote e-money fraud by value |
| Remote e-money fraud by transaction count | 0.014% | Remote e-money fraud by transaction count |
| Non-remote e-money fraud by transaction count | 0.003% | Non-remote e-money fraud by transaction count |
| Overall card fraud by value | 0.033% | Overall card fraud by value |
| Remote share of card payment value | 28% | Remote share of card payment value |
| Remote share of card payment count | 18% | Remote share of card payment count |
| Remote share of card fraud value | 83% | Remote share of card fraud value |
| Remote share of card fraud count | 83% | Remote share of card fraud count |
| Card value authenticated via SCA | 64% | Card value authenticated via SCA |
| Card transaction count authenticated via SCA | 40% | Card transaction count authenticated via SCA |
| Card fraud value involving a counterpart outside the EEA | 30% | Card fraud value involving a counterpart outside the EEA |
What changes when you compare the figures
| Comparison | Result | Calculation |
|---|---|---|
| Remote card fraud per 100,000 card payments | 68 fraudulent payments per 100,000 | = 0.068 * 1000 |
| Non-remote card fraud per 100,000 card payments | 3 fraudulent payments per 100,000 | = 0.003 * 1000 |
| Remote versus non-remote card fraud count-rate gap per 100,000 | 65 fraudulent payments per 100,000 | = (0.068 - 0.003) * 1000 |
| Remote card fraud rate versus overall card fraud rate by value | 2.76 times | = 0.091 / 0.033 |
| Average remote fraudulent card payment versus average remote card payment | 1.34 times | = 0.091 / 0.068 |
| Remote card fraud share versus remote transaction share by count | 65 percentage points | = 83 - 18 |
| Remote card and e-money count-rate gap per 100,000 | 54 fraudulent payments per 100,000 | = (0.068 - 0.014) * 1000 |
| Card SCA coverage by value versus count | 24 percentage points | = 64 - 40 |
Methodology and sources
We transcribed the 2024 full-year figures from the EBA and ECB’s 2025 payment fraud report. Multiply a published percentage by 1,000 to get the count per 100,000 transactions, or by 100 to get basis points of value. Channel ratios compare like denominators. The ratio of the value fraud rate to the count fraud rate within a channel estimates the average fraudulent payment value divided by the average value of all payments in that channel. Input percentages are rounded. Bank and payment-provider reports describe executed payment populations, not failed attempts or a measured merchant conversion effect.
Download the source data (CSV)
Download the calculations (CSV)
Related reading
Checkout payment statistics for wallets, cards and one-click checkout
Payment decline and retry statistics for online checkouts
Buy now, pay later statistics for ecommerce checkouts
Sources and definitions
European Banking Authority and European Central Bank, 2025 report on payment fraud
The source data includes the population, period, denominator and limitations for every figure.