


Quick answer
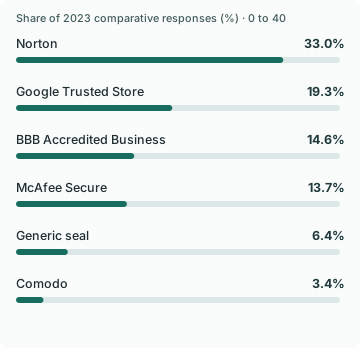
In a 2025 Baymard survey of 1,026 US adult internet users, 19% reported abandoning a checkout in the previous three months because they distrusted the site with their card details. In a separate 2023 study, the two most selected of nine pictured seals accounted for 52.3% of responses combined, based on rounded shares. Treat seal preferences as a clue about what shoppers recognize.
Baymard Institute, How Users Perceive Security During the Checkout Flow · Baymard, Visually Reinforce Your Credit Card Fields
Key findings and sources
Card-information distrust was a reported abandonment reason
In Baymard’s 2025 survey of 1,026 US adult internet users, 19% reported abandoning a checkout within the previous three months because they did not trust the site with their card information.
Baymard Institute, How Users Perceive Security During the Checkout Flow
The two most selected seals accounted for 52.3 percent
Checkout Closer’s calculation from the 2023 Baymard chart of 1,823 US adult responses gives 52.3% for the two most selected pictured seals and 80.6% for the four most selected. The exercise measured relative selection, not payment conversion.
Baymard Institute, How Users Perceive Security During the Checkout Flow
The generic seal led three named certificate seals
In Baymard’s 2023 comparative chart, the generic seal received 6.4% of responses versus 3.4% for Comodo, 2.2% for GeoTrust and 1.7% for Thawte. The generic-versus-Comodo difference was three percentage points.
Baymard Institute, How Users Perceive Security During the Checkout Flow
Visual reinforcement and nearby badge placement were rarely combined in one historical audit
In the benchmark published by Baymard in 2012, one of 100 top-grossing ecommerce sites combined a visually enclosed card form with a nearby security badge. That audit measured interface treatment in its own period.
Baymard, Visually Reinforce Your Credit Card Fields
Pictured trust badge choices were more concentrated than nine equal choices
Normalizing Baymard’s nine displayed 2023 seal shares by their rounded total of 100.2 gives about a 19.5% same-choice probability for two independent draws from that mix. Nine equal options would give 11.1%. This describes concentration in the pictured choices.
Baymard Institute, How Users Perceive Security During the Checkout Flow
Baymard’s 2023 comparative survey of 1,823 respondents; the unit is a selected pictured badge. Normalize each displayed share, square the normalized shares and sum them.
Only one of eleven historically reinforced payment forms used both cues
In Baymard’s April 2012 audit of the top 100 grossing ecommerce sites, 11 used at least some visual reinforcement of card fields and one used both enclosure and nearby badge placement. The conditional share was about 9.1%.
Baymard, Visually Reinforce Your Credit Card Fields
Historical audit of 100 grossing ecommerce sites, April 2012; this describes implementation, with no checkout outcome data. Divide one site combining both cues by eleven sites with at least some reinforcement.
Compare the results
A checkout can make a correct payment feel uncertain
Think of the moment a buyer reaches the card number field on a brand they have never ordered from. A button jumps, the total seems to disappear, or the buyer gets taken to a payment provider without an explanation. The store can have a working payment setup and still leave the buyer wondering whether they are in the right place. In its usability observations, Baymard reports that concerns often came up at the card entry interface and were easier to trigger for lesser-known brands.
Start with the layout and the handoff. Keep the store name and current order amount identifiable. Give card entry its own visual boundary. If the flow will briefly leave the current page for verification, explain what the buyer should expect and test what happens when they return. Reassurance works best when it describes something real that the shopper can observe.
Recognizability dominated the comparative badge survey
The two most selected images made up 52.3% of the rounded responses in Baymard’s comparative chart. The next two added 28.3 points, putting the four most selected choices at 80.6%. The generic seal received 6.4%, more than some named seals. This is good reason to separate what an image communicates from what the issuer of that image verifies.
The chart is an image-choice exercise, and some displayed marks reflect the period in which it ran. A store should display only marks it has a valid basis to use. Before spending time finding a logo, fix visual defects and try a plain explanation beside the part of the form that changes the customer’s level of risk. If customers continue to ask the same question, inspect the exact point at which they hesitate.
Measure the difference between hesitation and a failed payment
Start with eligible sessions that reach card entry. Track whether card entry begins, whether a payment is submitted, and whether the provider authorizes it. Where those events are available, distinguish a return from the verification step from an actual approval. A display change can move how many buyers submit a payment without changing how the provider handles submitted attempts.
If you are testing new copy or layout, use a consistent definition of a completed paid order and keep changes to methods, eligibility and fraud rules out of that comparison. Add shopper feedback on whether people understood where they were entering details or why verification appeared. A higher paid-order rate is the business outcome, and a clear feedback pattern can help explain the path that led there.
Badge responses were concentrated even after allowing for rounding
Baymard’s 2023 test offered nine pictured badges and asked which created the best sense of trust when paying online. The published choice shares sum to 100.2% because they are rounded. Normalizing by that total, two independent draws from the displayed response mix have about a 19.5% chance of matching on the same badge. Equal selection across nine options would give 11.1%. The comparison quantifies how concentrated the pictured choices were without predicting what any badge would do to purchases.
The five lowest-selected badges account for 19.6 displayed percentage points combined. That is slightly more than the 19.3 reported for the second-ranked badge alone. The result depends on which options respondents were shown, and some badges reflect recognition of a familiar name rather than a verified attribute of the checkout. The analysis can support a claim about relative choices in the picture test. Evidence of a particular store’s conversion gain would require its own experiment.
Test the payment area before changing the badge
In Baymard’s separate April 2012 audit of the top 100 grossing ecommerce sites, 11 used at least some visual reinforcement near sensitive fields and one used both field enclosure and a nearby badge. That is about 9.1% among the 11 sites that used some reinforcement. Its age and sample make the audit useful as a concrete design example, with limited relevance for estimating current adoption.
On the payment screen, keep the secure area visually coherent, explain whose payment surface the buyer has reached when there is a redirect, and make the continuation action clear. If the store can legitimately display a current verification badge, hold that badge fixed while testing whether placement or surrounding explanation helps. Measure payment starts, successful authorizations and paid orders among eligible sessions. A badge can move perception even if authorization behavior is unchanged. Where the merchant lacks verified permission to display a trust mark, test clear payment-form language and placement without making the verification claim.
Study data
| Measure | Value | Context |
|---|---|---|
| Seal selection: Norton | 33.0% | Seal selection: Norton |
| Seal selection: Google Trusted Store | 19.3% | Seal selection: Google Trusted Store |
| Seal selection: BBB Accredited Business | 14.6% | Seal selection: BBB Accredited Business |
| Seal selection: McAfee Secure | 13.7% | Seal selection: McAfee Secure |
| Seal selection: Generic seal | 6.4% | Seal selection: Generic seal |
| Seal selection: TRUSTe | 5.9% | Seal selection: TRUSTe |
| Seal selection: Comodo | 3.4% | Seal selection: Comodo |
| Seal selection: GeoTrust | 2.2% | Seal selection: GeoTrust |
| Seal selection: Thawte | 1.7% | Seal selection: Thawte |
| Respondents in the comparative seal study | 1,823 respondents | Respondents in the comparative seal study |
| Respondents in the card-information trust survey | 1,026 respondents | Respondents in the card-information trust survey |
| Reported abandoning because of card-information trust | 19% | Reported abandoning because of card-information trust |
| Measure | Value | Context |
|---|---|---|
| Historical audit sites without visual reinforcement | 89% | Historical audit sites without visual reinforcement |
| Historical audit sites that enclosed card fields and placed a seal nearby | 1 sites | Historical audit sites that enclosed card fields and placed a seal nearby |
| Measure | Value | Context |
|---|---|---|
| Historical sites using at least one visual reinforcement treatment | 11% | Published source value |
What changes when you compare the figures
| Comparison | Result | Calculation |
|---|---|---|
| Combined share of the two most selected pictured seals | 52.3% | = 33 + 19.3 |
| Combined share of the four most selected pictured seals | 80.6% | = 33 + 19.3 + 14.6 + 13.7 |
| Gap between the most selected and generic seal | 26.6 percentage points | = 33 - 6.4 |
| Generic seal minus Comodo seal | 3.0 percentage points | = 6.4 - 3.4 |
| Sum of nine displayed rounded percentages | 100.2% | = 33 + 19.3 + 14.6 + 13.7 + 6.4 + 5.9 + 3.4 + 2.2 + 1.7 |
| Chance that two independent draws from the displayed choice mix match | 19.4959% | = (33 * 33 + 19.3 * 19.3 + 14.6 * 14.6 + 13.7 * 13.7 + 6.4 * 6.4 + 5.9 * 5.9 + 3.4 * 3.4 + 2.2 * 2.2 + 1.7 * 1.7) / (100.2 * 100.2) * 100 |
| Same-choice probability if nine shown seals were selected equally | 11.1111% | = 100 / 9 |
| Share of historically reinforced checkouts using both treatments | 9.0909% | = 1 / 11 * 100 |
| Combined displayed choice shares for the five lowest-selected options | 19.6% | = 6.4 + 5.9 + 3.4 + 2.2 + 1.7 |
Methodology and sources
We transcribed the nine displayed shares from Baymard’s chart labeled 2023 and recalculated the stated sums and gaps from those rounded shares. The chart reports 1,823 US adult responses. The report’s separately described 2025 checkout trust survey uses 1,026 respondents and asks about prior abandonment. The published 2012 benchmark concerns interface treatment on audited sites. These three pieces of evidence answer different questions.
Download the source data (CSV)
Download the calculations (CSV)
Related reading
Checkout payment statistics for wallets, cards and one-click checkout
Payment decline and retry statistics for online checkouts
Sources and definitions
Baymard Institute, How Users Perceive Security During the Checkout Flow
Baymard Institute, Visually Reinforce Your Credit Card Fields
The source data includes the population, period, denominator and limitations for every figure.