


Quick answer
In the Federal Reserve’s 2025 household survey, 16% of US adults reported using buy now, pay later in the past year. Among users, 26% reported paying late. For adults with family income of $25,000 to $49,999, the survey reported 23% use and 33% late payment among users, implying about 7.59% of that income group did both.
Federal Reserve, Economic Well-Being of U.S. Households in 2025: Credit
Key findings and sources
BNPL usage and late payment have different bases
The Federal Reserve’s 2025 SHED found that 16% of US adults used buy now, pay later in the past year. Among those users, 26% reported paying late. The two percentages have different denominators.
Federal Reserve, Economic Well-Being of U.S. Households in 2025: Credit
A joint estimate from published subgroup rates
Among US adults with family income of $25,000 to $49,999, 23% reported BNPL use and 33% of users reported late payment in the Federal Reserve’s 2025 survey. Multiplying the two rounded rates implies about 7.59% of all adults in that income group did both.
Federal Reserve, Economic Well-Being of U.S. Households in 2025: Credit
The conditional late-payment ranking can differ from the joint estimate
In the 2025 SHED, late payment among BNPL users was 40% below $25,000 family income and 33% at $25,000 to $49,999. Combining those conditional rates with subgroup use implies 7.20% and 7.59% of all adults in the respective groups. Rounded inputs make this small difference illustrative.
Federal Reserve, Economic Well-Being of U.S. Households in 2025: Credit
Reasons for use differ by family income
In the Federal Reserve’s 2025 SHED, 40% of BNPL users with family income below $25,000 named affordability as their main reason, versus 15% among users at $100,000 or more. The comparable rates for spreading out payments were 25% and 38%.
Federal Reserve, Economic Well-Being of U.S. Households in 2025: Credit
BNPL use by age and late payment by age are separate comparisons
In the Federal Reserve’s 2025 SHED, 22% of adults ages 18 to 29 and 9% of adults 60 and over reported using BNPL. Late payment among users in those age groups was 32% and 12%, respectively.
Federal Reserve, Economic Well-Being of U.S. Households in 2025: Credit
The joint age-group difference was 5.96 points using rounded survey rates
Applying the Federal Reserve’s 2025 household survey rates, about 7.04% of adults ages 18 to 29 both used BNPL and paid late, compared with about 1.08% of adults 60 or older. This calculation multiplies use among adults by late payment among users in each age group.
Federal Reserve, Economic Well-Being of U.S. Households in 2025: Credit
Two Federal Reserve denominators imply about 2.7 percent of adults reported a late BNPL charge
In the Federal Reserve’s 2025 SHED, multiplying 16% BNPL use by the direct 17% late-charge share among users gives 2.72% of all adults. Multiplying 16% by 26% late payment and 64% charged among late payers gives 2.66%. Both use rounded survey estimates.
Federal Reserve, Economic Well-Being of U.S. Households in 2025: Credit
US adults surveyed in 2025; events refer to consumers over the survey’s reference period, not individual orders. Multiply nested reported proportions using the direct and indirect routes.
About 6.5 percent of BNPL users are implied to have reported both fee experiences
The 2025 SHED reports 17% of BNPL users were charged extra for paying late and 38% of that group reported an overdraft or NSF fee triggered by BNPL. Multiplying the rounded shares implies about 6.5% of BNPL users reported both experiences, with no same-transaction linkage.
Federal Reserve, Economic Well-Being of U.S. Households in 2025: Credit
US adults using BNPL in the Federal Reserve’s 2025 survey, conditional shares rounded in the source. Multiply the published share charged for lateness by the bank-fee share within that subgroup.
Compare the results
Use and late payment answer different questions
The Federal Reserve reported that 16% of adults used BNPL in the prior year. Of that smaller group, 26% said they made a late payment. A checkout team would misread the study by treating the 26% as a share of all shoppers or by interpreting the 16% as the share who would select installments in a particular store. Those numbers describe different steps: first, whether adults used BNPL anywhere, and then whether those users paid late.
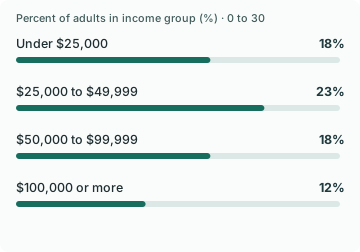
Putting the two measures on a shared denominator changes which group appears largest. Among users in the lowest income group, 40% reported late payment, compared with 33% of users in the $25,000 to $49,999 group. But use was 18% in the first group and 23% in the second. Applying those rates to all adults within each group gives approximately 7.20% and 7.59%, respectively. That close difference should not be treated as a reliable ranking from rounded point estimates. It shows why the conditional rate alone can produce a different impression.
The contrast is larger at the top end of the published income categories. Adults with family income of at least $100,000 had 12% reported use, and 11% of users paid late, implying about 1.32% did both. That is a population comparison. The survey does not reveal any individual buyer’s finances or tell a merchant which shopper will pay late.
The same option can solve different checkout problems
Among BNPL users overall, 31% named spreading out payments as their main reason and 29% named affordability. The balance differs by income. At family income below $25,000, 40% of users named affordability and 25% named spreading out payments. At $100,000 or more, 15% named affordability and 38% named spreading out payments. A single message about easier budgeting would miss part of the reason customers say they use it.
For a merchant, the useful question is whether the buyer can understand the payable amount and terms before leaving the checkout. Label the payment option so the shopper can distinguish the amount charged now from the total amount of the purchase. Check the description and displayed terms against what the provider actually offers for the selected cart and market. If a shopper asks about a fee, use the provider’s current terms or send them to those terms instead of generalizing from a survey result.
A survey of past use can help choose what to explain. It cannot show whether an installment option should appear more prominently, whether it would add sales, or whether a shopper would have purchased using another method. Those are separate questions about the store’s checkout.
Measure selection, successful payment and completed orders separately
Instrument a local comparison with an explicit base for each outcome. Among eligible checkouts, measure how often the option appears and is selected. Among selections, record whether the provider step completes. Among all eligible assigned checkouts, measure completed orders and contribution, with cancellations and refunds treated consistently. This makes it possible to distinguish demand for the option from a broken route or a provider decision.
Age illustrates why the outside benchmark should be kept separate from a rollout forecast. The survey reported 22% use among adults ages 18 to 29 and 9% among adults 60 and older, a 13-point gap. Late payment among users was 32% versus 12%, a 20-point gap on a different denominator. The figures can suggest what to investigate in aggregated evidence. They do not justify deciding which individual sees an option based on a demographic label.
If the business needs to know whether adding or moving the option increases completed orders, use a controlled comparison over an agreed observation window. Check whether the change adds purchases across all eligible checkouts, shifts customers away from other payment methods, or merely creates more selections that fail to finish. The last two outcomes can look similar if the dashboard ends at the click.
Translate the age comparisons to a common population
The Federal Reserve’s 2025 household survey gives a useful example of what happens when two percentages have different bases. Among adults ages 18 to 29, 22% used buy now, pay later in the prior year. Among users in that group, 32% paid late. Multiplying the rounded rates gives about 7.04 per 100 adults in the age group who both used the method and paid late. The equivalent multiplication for people 60 and older gives about 1.08 per 100 adults, from 9% use and 12% late among users.
The resulting 5.96-point gap is a comparison between age groups on a common definition. The 20-point difference in late payment among users answers a different question. If a DTC team discusses the results internally, it should keep both bases visible so the larger conditional gap cannot be mistaken for the difference among all buyers.
For a store experiment, start with eligible paid-checkout sessions and ask whether adding or repositioning the method increases completed orders and contribution after the applicable costs. Changes in method share can be informative without settling either question. The household survey does not estimate how one store’s customers will respond or how many would otherwise use cards. It supports careful measurement of take-up alongside the separate commercial outcome.
Follow the fee all the way back to the right denominator
Three denominators separate the common headline from the people it describes. The Federal Reserve’s 2025 survey puts BNPL use at 16% of adults. Of those users, 26% reported paying late, and 64% of late payers reported an extra charge. Multiplying the displayed margins gives about 2.66% of all adults who used BNPL and reported being charged extra for lateness. The report also states the late-charge share directly as 17% of users. Multiplying that figure by the 16% use rate gives 2.72%. Both routes support an estimate of about 2.7% of all adults. Their 0.06-point difference is compatible with the displayed rounding.
This is a useful way to quote the numbers when the denominator matters to the story. The 64% is a rate for late payers, while 2.7% refers to the overall adult population. Neither is the fee incidence per BNPL order at a particular store. A frequent buyer and an occasional user each contribute a person to the survey.
Late charges and bank fees can occur in the same customer experience
The report says 11% of BNPL users had an overdraft or non-sufficient-funds fee triggered by a BNPL payment. It also says 38% of users who reported an extra charge for paying late experienced a triggered bank fee. Multiplying 17% by 38% implies that about 6.46% of all BNPL users reported both in the survey period. The figures identify overlapping experiences for a person. They cannot identify whether both charges arose on the same transaction.
For a store, explain the scheduled amount, what happens after a missed payment, and where to get a provider-specific answer. During a test, group support contacts by what the buyer was trying to clarify and compare order completion, returns, and payment-related contacts on the same eligible population. If the provider cannot report downstream financial outcomes by order, limit the rollout decision to the merchant outcomes you can measure. Use the survey to improve the disclosure and support path rather than estimating fees your customers will incur.
Study data
| Measure | Value | Context |
|---|---|---|
| BNPL use: Under $25,000 | 18% | BNPL use: Under $25,000 |
| Late payment among BNPL users: Under $25,000 | 40% | Late payment among BNPL users: Under $25,000 |
| BNPL use: $25,000 to $49,999 | 23% | BNPL use: $25,000 to $49,999 |
| Late payment among BNPL users: $25,000 to $49,999 | 33% | Late payment among BNPL users: $25,000 to $49,999 |
| BNPL use: $50,000 to $99,999 | 18% | BNPL use: $50,000 to $99,999 |
| Late payment among BNPL users: $50,000 to $99,999 | 25% | Late payment among BNPL users: $50,000 to $99,999 |
| BNPL use: $100,000 or more | 12% | BNPL use: $100,000 or more |
| Late payment among BNPL users: $100,000 or more | 11% | Late payment among BNPL users: $100,000 or more |
| BNPL use: Ages 18 to 29 | 22% | BNPL use: Ages 18 to 29 |
| Late payment among BNPL users: Ages 18 to 29 | 32% | Late payment among BNPL users: Ages 18 to 29 |
| BNPL use: Ages 30 to 44 | 21% | BNPL use: Ages 30 to 44 |
| Late payment among BNPL users: Ages 30 to 44 | 31% | Late payment among BNPL users: Ages 30 to 44 |
| BNPL use: Ages 45 to 59 | 17% | BNPL use: Ages 45 to 59 |
| Late payment among BNPL users: Ages 45 to 59 | 22% | Late payment among BNPL users: Ages 45 to 59 |
| BNPL use: Ages 60 and over | 9% | BNPL use: Ages 60 and over |
| Late payment among BNPL users: Ages 60 and over | 12% | Late payment among BNPL users: Ages 60 and over |
| BNPL use: Overall | 16% | BNPL use: Overall |
| Late payment among BNPL users: Overall | 26% | Late payment among BNPL users: Overall |
| Main reason was spreading out payments: Overall | 31% | Main reason was spreading out payments: Overall |
| Main reason was affordability: Overall | 29% | Main reason was affordability: Overall |
| Main reason was spreading out payments: Under $25,000 | 25% | Main reason was spreading out payments: Under $25,000 |
| Main reason was affordability: Under $25,000 | 40% | Main reason was affordability: Under $25,000 |
| Main reason was spreading out payments: $100,000 or more | 38% | Main reason was spreading out payments: $100,000 or more |
| Main reason was affordability: $100,000 or more | 15% | Main reason was affordability: $100,000 or more |
| Adults who paid late and said they were charged extra, among late BNPL users | 64% | Published source value |
| BNPL users reporting an extra charge for a late payment | 17% | Published source value |
| BNPL users reporting a triggered overdraft or NSF charge | 11% | Published source value |
| Users reporting an overdraft or NSF charge, among users charged extra for late payment | 38% | Published source value |
What changes when you compare the figures
| Comparison | Result | Calculation |
|---|---|---|
| Implied share of adults who used BNPL and paid late: Under $25,000 | 7.2% | = 18 * 40 / 100 |
| Implied share of adults who used BNPL and paid late: $25,000 to $49,999 | 7.59% | = 23 * 33 / 100 |
| Implied share of adults who used BNPL and paid late: $50,000 to $99,999 | 4.5% | = 18 * 25 / 100 |
| Implied share of adults who used BNPL and paid late: $100,000 or more | 1.32% | = 12 * 11 / 100 |
| Difference in implied joint share: $25,000–$49,999 vs $100,000 or more | 6.27 percentage points | = 7.59 - 1.32 |
| Usage gap between ages 18 to 29 and 60 and over | 13 percentage points | = 22 - 9 |
| Conditional late-payment gap between the same age groups | 20 percentage points | = 32 - 12 |
| Affordability reason gap between lowest and highest income groups | 25 percentage points | = 40 - 15 |
| Implied BNPL use and late payment among adults ages 18 to 29 | 7.04% | = 22 * 32 / 100 |
| Implied BNPL use and late payment among adults ages 60 and over | 1.08% | = 9 * 12 / 100 |
| Implied joint age-group difference | 5.96 percentage points | = (22 * 32 / 100) - (9 * 12 / 100) |
| Approximate all-adult share reporting a late BNPL charge via the direct user margin | 2.72% | = 16 * 17 / 100 |
| Approximate all-adult share reporting a late BNPL charge via three nested margins | 2.6624% | = 16 * 26 * 64 / 10000 |
| Gap between the two rounded input routes to the all-adult estimate | 0.0576 percentage points | = 2.72 - 2.6624 |
| Implied share of BNPL users reporting both types of charges | 6.46% | = 17 * 38 / 100 |
| Approximate share of overdraft or NSF reporters also reporting a late charge | 58.7273% | = 6.46 / 11 * 100 |
Methodology and sources
We transcribed Table 41 and selected cells from Table 42 of the Federal Reserve’s 2025 SHED credit chapter. Usage is measured among all US adults in a row. Late payment is measured among BNPL users in that same row. To calculate the implied share of all subgroup adults who both used BNPL and paid late, we multiply the two published rounded percentages and divide by 100. The result is an approximation, with no confidence interval calculated from the published aggregates. Reasons are conditional on past-year users and refer to the main reason.
Download the source data (CSV)
Download the calculations (CSV)
Related reading
Checkout payment statistics for wallets, cards and one-click checkout
Payment decline and retry statistics for online checkouts
Sources and definitions
Federal Reserve, Economic Well-Being of U.S. Households in 2025: Credit
The source data includes the population, period, denominator and limitations for every figure.