


Quick answer
Stripe and Edgar, Dunn & Company’s 2022 audits found Google Pay absent on 93% of reviewed North American checkouts and 86% of reviewed European checkouts. Apple Pay was absent on 86% and 89%, respectively. In separate surveys, 75% of North American and 78% of European respondents said one-click checkout would make buying more likely. An audit tells you what appeared during testing; a survey tells you what shoppers said they wanted.
Stripe and Edgar, Dunn & Company, The State of North American Checkouts in 2022 · Stripe and Edgar, Dunn & Company, The State of European Checkouts in 2022
Key findings and sources
How common was Apple Pay absence in audited checkouts?
Stripe and Edgar, Dunn & Company’s 2022 audits reported that 86% of reviewed North American ecommerce checkouts and 89% of reviewed European ecommerce checkouts lacked Apple Pay support. These results describe simulated audits of leading sites at the time.
Stripe and Edgar, Dunn & Company, The State of North American Checkouts in 2022 · Stripe and Edgar, Dunn & Company, The State of European Checkouts in 2022
How common was Google Pay absence in audited checkouts?
Stripe and Edgar, Dunn & Company’s 2022 audits reported that 93% of reviewed North American ecommerce checkouts and 86% of reviewed European ecommerce checkouts lacked Google Pay support, a seven percentage-point difference between the historical samples.
Stripe and Edgar, Dunn & Company, The State of North American Checkouts in 2022 · Stripe and Edgar, Dunn & Company, The State of European Checkouts in 2022
Did shoppers say one-click checkout makes them more likely to buy?
In Stripe and Edgar, Dunn & Company’s 2022 surveys, 75% of North American respondents and 78% of European respondents said one-click checkout would make a purchase more likely. The regional surveys involved 216 and 870 respondents overall, respectively, and asked about preferences rather than measuring conversion.
Stripe and Edgar, Dunn & Company, The State of North American Checkouts in 2022 · Stripe and Edgar, Dunn & Company, The State of European Checkouts in 2022
How common was the missing numeric keypad?
In Stripe and Edgar, Dunn & Company’s 2022 checkout audits, 17% of North American and 24% of European audited ecommerce checkouts did not bring up a numeric keypad for card entry. Those are simulated checkout findings, not failed payment rates.
Stripe and Edgar, Dunn & Company, The State of North American Checkouts in 2022 · Stripe and Edgar, Dunn & Company, The State of European Checkouts in 2022
What share of US consumer payments used credit and debit?
The Federal Reserve’s 2025 Diary of Consumer Payment Choice reports that credit cards represented 35% and debit cards 30% of US consumer payments by count in 2024. The diary covers broader consumer payments and does not isolate ecommerce checkout.
Federal Reserve Financial Services, 2025 Diary of Consumer Payment Choice
The latest diary finds little change in combined card use
In the Federal Reserve’s 2026 Diary, US consumers averaged 16.64 credit-card and 14.27 debit-card payments monthly in 2024, compared with 16.14 and 14.70 in 2025. The combined monthly figure changed from 30.91 to 30.84. The estimates describe broad consumer payments, including bills, rather than an ecommerce checkout mix.
Federal Reserve Financial Services, 2026 Findings from the Diary of Consumer Payment Choice
Wallet coverage ranked differently in the two historical audits
Complements of Stripe’s 2022 absence figures put Apple Pay and Google Pay support at 14% and 7% in the North American audit and 11% and 14% in the European audit. These are shares of audited checkouts, not shares of shoppers or payments.
Stripe and Edgar, Dunn & Company, The State of North American Checkouts in 2022 · Stripe and Edgar, Dunn & Company, The State of European Checkouts in 2022
The historical wallet audit margins bound combined availability
From Stripe’s 2022 audited wallet margins, the share of North American checkouts offering at least one of Apple Pay and Google Pay is bounded by 14% and 21%, versus 14% to 25% in the European audit. The bounds use rounded reported percentages and allow for unknown overlap.
Stripe and Edgar, Dunn & Company, The State of North American Checkouts in 2022 · Stripe and Edgar, Dunn & Company, The State of European Checkouts in 2022
Card payment share rose while monthly card payments per person fell slightly
Federal Reserve Diary endnotes imply combined credit and debit made up about 64.13% of all payments in 2024 and 65.20% in 2025, while combined monthly card payments fell from 30.91 to 30.84 per consumer.
Federal Reserve Financial Services, 2026 Findings from the Diary of Consumer Payment Choice
US consumer diary estimates covering all payment contexts in 2024 and 2025. Divide reported monthly credit plus debit payments by reported total monthly payments in each year.
Credit made up a smaller share of the combined card count
Using the Federal Reserve’s endnote means, credit represented about 53.83% of combined monthly credit and debit payments in 2024 and 52.33% in 2025. Those shares describe card payments across consumer contexts.
Federal Reserve Financial Services, 2026 Findings from the Diary of Consumer Payment Choice
US Diary estimates in the Federal Reserve Financial Services 2026 report. Divide average monthly credit count by the sum of average credit and debit counts in each year.
Compare the results
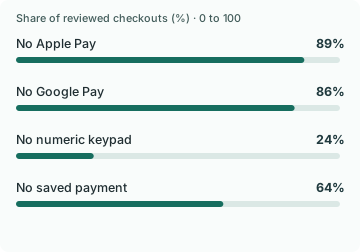
How did payment friction differ across the two audits?
Stripe and Edgar, Dunn & Company published a 2022 audit of top ecommerce websites in the United States and Canada and a companion audit spanning eight European markets. The checkouts do not line up in the same order for every measure. In the European audit, Apple Pay was absent on 89% of checkouts and Google Pay on 86%. The North American results were 86% and 93%, respectively. Apple Pay absence was three percentage points higher in the European sample, while Google Pay absence was seven points higher in North America. The audit also reported seven points more missing numeric keypads in Europe, 24% versus 17%.
Read those as historical observations of comparable audit criteria. The researchers simulated purchase attempts and sometimes used a VPN to represent a local shopper. The audit did not establish current acceptance at a specific store, what share of its shoppers qualified for a wallet or the lift from switching wallets. For a merchant the actionable comparison is which option appears for the actual buyer route.
Why preference and availability belong on different lines
The same report includes survey answers from 216 North American and 870 European consumers. When a site offered one-click checkout, 75% of the North American sample and 78% of the European sample said they would be more likely to purchase. The European survey also reports 62% for France and 57% for the UK. That variation matters when deciding where to observe real demand first, but the report does not publish the subgroup sample sizes or uncertainty. The five-point difference is descriptive.
One-click checkout can also mean several different implementations. A returning buyer may use a saved card, while a first-time buyer has to use a compatible wallet. Stripe audited saved payment information separately. It was absent in 60% of reviewed North American checkouts and 64% of reviewed European checkouts. Adding a visible wallet button does not create a saved-card path, and moving a saved-card button to the first screen does not make it eligible for a first-time buyer.
Use payment diaries to check what the checkout survey leaves out
The Federal Reserve’s 2025 US Diary of Consumer Payment Choice describes payments people recorded, including activity outside retail checkout. Credit cards made up 35% and debit cards 30% of consumer payments by number in 2024. Purchases and peer-to-peer payments made remotely were 23% of their own combined category. That does not identify a preferred checkout interface or measure ecommerce payments in isolation. It does show why a store should keep ordinary card entry usable while testing an express option.
For a mobile-first storefront, make card entry and an eligible wallet separate scenarios in your test plan. A shopper can fund a wallet from a debit or credit card, so a card instrument and a wallet interface are different dimensions. Separate them in reporting or the store can misread changes in interface usage as changes in how payments were funded.
Find out whether the shopper saw the payment method
A useful checkout event records the method displayed before it records the method selected. Build the journey from eligible checkout, to visible method, to attempted payment, to authorized payment, to completed order. If your only event is the order, you cannot distinguish a checkout that never showed Google Pay from one in which a shopper simply picked a card. Keep device, browser, country and currency on each event.
An existing Apple Pay button should open the eligible payment flow for the supported route. Check both an eligible and an ineligible session and make sure that the latter still has a workable alternative. For a recovery link, repeat the test in the browser the message actually opens. A new route can open the full site in a different browsing context even when the link looks like the usual checkout.
Tie payment improvements to paid orders
Imagine 1,000 eligible mobile checkouts. The wallet is shown to 700 shoppers, attempted by 140 and authorized for 126. That gives 70% visibility among eligible checkouts, 20% take-up among visible checkouts and 90% authorization among attempts. An increase in take-up after moving a button is a change in method use. Test whether total paid orders rise across all methods before allocating projected revenue to it.
The countercase is displacement. An easier wallet can move buyers out of manual card entry without adding new buyers. That can still reduce friction, and it may be worth doing. Report the measured change, especially when cost, fraud handling or refunds differ between the payment paths. Investigate a failed authorization separately from a button that never appeared.
The latest payment diary shows how rounding can change the story
The Federal Reserve’s 2026 Diary reports 16.14 credit-card payments and 14.70 debit-card payments per consumer per month in 2025. In 2024 the corresponding figures were 16.64 and 14.27. One average dropped by 0.50 and the other rose by 0.43. The rounded report summary describes one fewer credit payment and one more debit payment, which can make the shift sound larger than the underlying estimates. Adding the unrounded figures, combined credit and debit changed from 30.91 to 30.84 payments per consumer per month.
That is a useful reason to examine your own checkout rather than change its ordering from a rounded national headline. The diary covers broader payments, including bills. For one store, compare which methods qualified and appeared, which shoppers selected, and which resulted in a paid order. Keep mobile and desktop, country and browser coverage visible when sample size permits. A small change in payment mix can be less important than a method disappearing at a step where buyers had already chosen it.
Look at wallet coverage in the shopper’s actual checkout
Stripe’s 2022 audit reported the share of checkouts where each wallet was absent. Subtracting those shares from 100 gives Apple Pay support of 14% and Google Pay support of 7% in the North American audit. In the European audit, the corresponding support shares were 11% and 14%. The order reverses. The Apple-minus-Google gap was seven points in North America and minus three points in Europe, a ten-point change between the two audited groups.
These are historical site-level audits. The numbers do not show which customers could actually see a wallet at payment, how many selected it, or the current market ranking. The two support shares also cannot be added to find how many checkouts offered either wallet because the same checkout may support both.
For an operational check, use the device, browser, market and payment setup your shoppers actually encounter. First confirm the wallet is configured. Then observe whether it appears for an eligible shopper and completes through the same cart. A wallet enabled on paper can still fail the practical checkout test if the route the buyer takes does not surface it. Keep the actual presentment result separate from the share of orders paid by wallet.
Bound wallet coverage when you only have separate payment rows
An audit can tell you how many checkouts offered Apple Pay and how many offered Google Pay without saying how often they appeared together. In Stripe’s 2022 North American audit, 14% offered Apple Pay and 7% offered Google Pay, using complements of the published missing-method rates. The share offering at least one therefore falls between 14% and 21%, allowing for any overlap. If every Google Pay checkout also offered Apple Pay, the smaller group would add nothing to the larger one. If the groups were disjoint, the two percentages could be added.
The equivalent European figures give a range of 14% to 25%, from 11% Apple Pay and 14% Google Pay. That is a range based on rounded margins, and it is not the measured share of stores offering both. Ranking the two regions by whether a buyer would see at least one method is therefore harder than ranking them on each method individually.
On your own checkout, measure actual method visibility on eligible sessions rather than count integrations in the admin panel. Check a supported device, an unsupported device, guest and returning checkout, and a relevant country and currency. Record whether a button was shown, whether it was used and whether a paid order followed. Use those observations to distinguish a method that serves an uncovered buyer from one that mostly gives already-served buyers a second option.
A larger share of payments can hide a flat number of card payments
Payment method mix can move when shoppers make fewer payments overall. The Federal Reserve diary puts combined monthly credit and debit use at 30.91 payments per consumer in 2024 and 30.84 in 2025. During the same period the total fell from 48.2 to 47.3 payments per consumer. Dividing the combined card counts by the total produces a share of about 64.13% in 2024 and 65.20% in 2025. A 1.07-point share increase accompanies a small decline in the number of card payments per person.
The mix inside the card category changed too. Credit represented roughly 53.83% of the combined credit and debit count in 2024 and 52.33% in 2025. These calculations use rounded published means. They describe a national diary covering consumer payments, including transactions outside retail checkout and some bill payments. The source cautions that small year-to-year changes may be normal fluctuation.
Track wallet visibility, selection and settlement as different steps
A wallet can sit on top of a card. If your report tags a single order as both a wallet payment and a credit card payment, summing method shares will overstate demand. For a checkout decision, group by the customer-facing method first. Keep the underlying instrument in a separate field when your payment provider supplies it. Compare the number of eligible sessions that saw a wallet with the number of those shoppers who used it and the number of orders that settled.
The historical Stripe audits show why exposure needs its own denominator. A buyer can want one-click checkout and be unable to use it in a particular browser, country, or cart. When testing an express button, hold the set of eligible visitors fixed across the experiment and include failed and cancelled wallet attempts in the readout. If a payment method works for one-time orders and fails for subscriptions or mixed carts, report those routes separately before expanding the feature. A rising wallet share among completions is useful for diagnosing buyer preferences, while the rollout decision belongs to incremental paid orders and net costs per eligible checkout.
Payment availability is specific to the route
A wallet button can be visible on the product page and absent when the shopper opens a recovery link. A cart link may open inside a messaging browser, while the wallet was tested in the phone’s normal browser. Destination, browser and device belong in the test record along with the payment method.
Create a fresh cart, open its return link in the context the shopper will actually use, and record the methods that appear. Try the equivalent route in the system browser. Repeat for the main markets and currencies you sell in. Keep saved credentials and prior test sessions from masking what a first-time customer sees.
Card entry and authorization deserve separate checks
The audit reported that 17% failed to show a numeric keypad for card entry. That is an input problem, even though the shopper may say the card “isn’t working.” An authorization failure occurs later. Reproducing the point of failure gives support something concrete to act on.
If the buyer got an error after pressing Pay, check order and payment status first. If checkout is still unpaid, direct them to the secure checkout and explain any verified alternative. Never ask for card details over chat or offer repeated payment attempts while the status is unclear.
Use a separate row for every failure
Keep a record of device, browser, country, currency, the payment options displayed, and the last step that worked. A wallet that never appeared, a card form that rejected input and a declined payment may produce the same abandoned checkout event. They should land in different queues.
Use the historical audit as a source of failure cases to reproduce. Rank the fixes using your own verified failures and the number of buyers who encountered each one. That gives the checkout team a priority order they can defend.
Study data
| Measure | Value | Context |
|---|---|---|
| Checkout did not support Apple Pay | 86% | Audited checkout feature |
| Checkout did not support Google Pay | 93% | Audited checkout feature |
| No numeric keypad for card entry | 17% | Audited mobile input behavior |
| No way to save a payment method for later purchases | 60% | Audited checkout feature |
| North American consumers saying local common payment methods matter | 93% | Respondents said websites should provide payment methods common in their country. |
| North American consumers who said they frequently abandon without their preferred payment method | 81% | Frequently was the wording used in the published report. |
| North American consumers more likely to purchase when one-click checkout is available | 75% | Self-reported purchase likelihood. |
| Measure | Value | Context |
|---|---|---|
| European audited checkouts that lacked Apple Pay support | 89% | No Apple Pay support on the audited checkout route. |
| European audited checkouts that lacked Google Pay support | 86% | No Google Pay support on the audited checkout route. |
| European audited checkouts with no numeric keypad for card entry | 24% | Numeric keypad did not appear when entering card information. |
| European audited checkouts without saved payment for future purchases | 64% | Audit did not find the ability to save payment details for future one-click purchases. |
| European consumers saying local common payment methods matter | 95% | Respondents said it was important for websites to offer locally common methods. |
| European consumers very likely to abandon without their preferred payment method | 86% | Very likely was the wording used in the published report. |
| European consumers more likely to purchase when one-click checkout is available | 78% | Self-reported purchase likelihood. |
| French consumers more likely to purchase when one-click checkout is available | 62% | France subgroup. |
| UK consumers more likely to purchase when one-click checkout is available | 57% | UK subgroup. |
| Measure | Value | Context |
|---|---|---|
| Credit card share of US consumer payments | 35% | Share of payments by count across instrument types. |
| Debit card share of US consumer payments | 30% | Share of payments by count across instrument types. |
| Remote share of US consumer purchases and peer-to-peer payments | 23% | The numerator includes remote purchases and remote peer-to-peer payments. |
| Measure | Value | Context |
|---|---|---|
| Monthly US consumer credit-card payments in 2024 | 16.64 payments per month | Published unrounded monthly average |
| Monthly US consumer credit-card payments in 2025 | 16.14 payments per month | Published unrounded monthly average |
| Monthly US consumer debit-card payments in 2024 | 14.27 payments per month | Published unrounded monthly average |
| Monthly US consumer debit-card payments in 2025 | 14.7 payments per month | Published unrounded monthly average |
| Monthly US consumer payments in 2024 | 48.2 payments per month | Published unrounded monthly average |
| Monthly US consumer payments in 2025 | 47.3 payments per month | Published unrounded monthly average |
| Participants in the 2025 Diary of Consumer Payment Choice | 6,079 people | Published source value |
What changes when you compare the figures
| Comparison | Result | Calculation |
|---|---|---|
| Google Pay gap over Apple Pay | 7 percentage points | = 93 − 86 |
| European versus North American Apple Pay absence | 3 percentage points | = 89 minus 86 |
| North American versus European Google Pay absence | 7 percentage points | = 93 minus 86 |
| European versus North American numeric-keypad absence | 7 percentage points | = 24 minus 17 |
| European versus North American saved-payment absence | 4 percentage points | = 64 minus 60 |
| France versus UK stated one-click purchase likelihood | 5 percentage points | = 62 minus 57 |
| Change in credit-card payments per consumer | -0.5 payments per month | = 16.14 - 16.64 |
| Change in debit-card payments per consumer | 0.43 payments per month | = 14.70 - 14.27 |
| Change in combined debit and credit payments per consumer | -0.07 payments per month | = (16.14 + 14.70) - (16.64 + 14.27) |
| Audited North American Apple Pay support | 14% | = 100 - 86 |
| Audited North American Google Pay support | 7% | = 100 - 93 |
| Audited European Apple Pay support | 11% | = 100 - 89 |
| Audited European Google Pay support | 14% | = 100 - 86 |
| Change in the Apple-minus-Google support gap between regions | 10 percentage points | = (14 - 7) - (11 - 14) |
| North American minimum share offering at least one wallet from rounded margins | 14% | = 100 - 86 |
| North American maximum share offering at least one wallet from rounded margins | 21% | = (100 - 86) + (100 - 93) |
| European minimum share offering at least one wallet from rounded margins | 14% | = 100 - 86 |
| European maximum share offering at least one wallet from rounded margins | 25% | = (100 - 89) + (100 - 86) |
| Approximate share of all payments made with credit or debit in 2024 | 64.1286% | = (16.64 + 14.27) / 48.2 * 100 |
| Approximate share of all payments made with credit or debit in 2025 | 65.2008% | = (16.14 + 14.70) / 47.3 * 100 |
| Change in the reconstructed card share of all payments | 1.0722 percentage points | = ((16.14 + 14.70) / 47.3 - (16.64 + 14.27) / 48.2) * 100 |
| Change in credit share within combined credit and debit payments | -1.4991 percentage points | = (16.14 / (16.14 + 14.70) - 16.64 / (16.64 + 14.27)) * 100 |
Methodology and sources
The authors describe simulated shopping on 100 leading US and Canadian ecommerce sites against 26 criteria. We use the mobile optimization figures from the article and subtract 86 from 93 to calculate the gap. The audit does not tell us how often shoppers tried a missing method or whether a method is supported on those sites today.
Stripe and Edgar, Dunn & Company conducted simulated checkout audits and separate preference surveys. They describe the North American audit as top ecommerce sites from the United States and Canada, with 100 sites in the methodology, and the European audit as the top 100 sites from each of eight markets. They evaluated 26 criteria and supplemented sales rankings with traffic rankings where necessary. The four derived audit gaps compare the same published criterion across the two regional audit samples. The France–UK comparison uses one survey question and is descriptive. Federal Reserve figures come from a different US diary study and are kept separate from both the audit and the preference results.
Download the source data (CSV)
Download the calculations (CSV)
Related reading
Payment decline and retry statistics for online checkouts
Buy now, pay later statistics for ecommerce checkouts
Sources and definitions
Stripe and Edgar, Dunn & Company, The State of North American Checkouts in 2022
Stripe and Edgar, Dunn & Company, The State of European Checkouts in 2022
Federal Reserve Financial Services, 2025 Diary of Consumer Payment Choice
Federal Reserve Financial Services, 2026 Findings from the Diary of Consumer Payment Choice
The source data includes the population, period, denominator and limitations for every figure.