


Quick answer
In the MRC’s 2025 merchant survey, 44% reported network tokens and 40% gateway tokens, while 60% used at least one. Those rounded shares imply about 24% used both. The overall rate fell seven points from 2024 even as network-token use was one point higher.
MRC, Visa Acceptance Solutions and Verifi, 2025 Global eCommerce Payments & Fraud Report
Key findings and sources
About 24% of respondents used both token types
Checkout Closer’s calculation from MRC Figure 17 suggests that about 24% of payment-professional respondents in the 2025 edition used both network and gateway tokens.
MRC, Visa Acceptance Solutions and Verifi, 2025 Global eCommerce Payments & Fraud Report
2025 MRC payment-professional panel, n=562, rounded merchant survey shares. Add 44% network and 40% gateway, then subtract the 60% net adoption share.
Gateway-only adoption differed by eight points
The implied gateway-only share was 24% in the 2024 MRC sample and 16% in the 2025 sample, an eight-point difference between survey waves.
MRC, Visa Acceptance Solutions and Verifi, 2025 Global eCommerce Payments & Fraud Report
MRC payment-professional samples, n=667 in 2024 and n=562 in 2025. Compute the overlap in each wave and subtract it from gateway adoption.
Either token type was 43 points more common among enterprises
In the 2025 MRC survey, 77% of enterprise and 34% of small-business respondents reported either token type, a 43-percentage-point gap.
MRC, Visa Acceptance Solutions and Verifi, 2025 Global eCommerce Payments & Fraud Report
2025 MRC enterprise n=269 and small-business n=142. Subtract 34 from 77.
The overall and network-token figures moved in different directions
Net tokenization adoption was seven points lower in the 2025 MRC edition than in 2024, while network-token adoption was one point higher.
MRC, Visa Acceptance Solutions and Verifi, 2025 Global eCommerce Payments & Fraud Report
Two separately surveyed payment-professional samples. Compare 60 with 67 for net adoption, and 44 with 43 for network adoption.
Compare the results
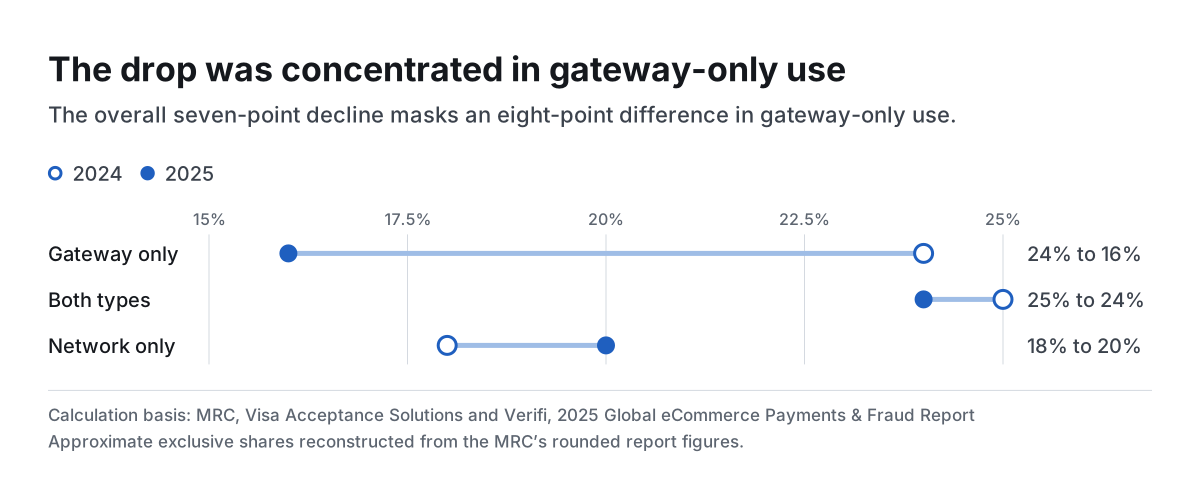
The drop was concentrated in gateway-only use
The overall seven-point decline masks an eight-point difference in gateway-only use.
One adoption number can hide two different decisions
The survey’s two token categories overlap. A merchant can use a gateway token as a reference in one processor’s vault and also use a network token elsewhere in its payment stack. Summing the two categories would count dual users twice. Using the reported net adoption gives about 24% using both in the 2025 edition, 20% using network tokens only and 16% using gateway tokens only.
The 2024 implied split was about 25% both, 18% network only and 24% gateway only. That means the share that reported gateway tokens alone fell eight points between the two samples. The result identifies where the difference appears in the survey, not which merchants migrated or why.
Merchant size changes the comparison
The 2025 survey reports use of either token type for 77% of enterprise respondents, 54% of mid-market respondents and 34% of small-business respondents. The enterprise-to-small-business gap is 43 points. It is useful context for vendor conversations. It does not make an enterprise architecture the right choice for a smaller store.
Ask how much of your current volume depends on a stored credential, whether the credential survives a gateway change and who updates it when card details change. In a multi-processor setup, trace the token used on every route before changing primary or fallback processing.
Test returning-customer payments as their own path
Run a controlled test with your processor using supported test cards and approved scenarios. Compare new-card orders with saved-card orders. Record authorization, confirmed payment and any extra verification step, and separate deliberate issuer declines from technical problems. Log only the non-sensitive identifiers your existing payment setup supports.
For a returning shopper with a failed payment, a secure link to the current checkout can preserve the cart without asking them to send card details. Validate what the buyer sees when the stored credential is unavailable, expired or needs confirmation.
Study data
| Measure | Value | Context |
|---|---|---|
| 2025 any token | 60% | Published source value |
| 2024 any token | 67% | Published source value |
| 2025 network tokens | 44% | Published source value |
| 2024 network tokens | 43% | Published source value |
| 2025 gateway tokens | 40% | Published source value |
| 2024 gateway tokens | 49% | Published source value |
| 2025 reported no tokenization | 32% | Published source value |
| 2024 reported no tokenization | 25% | Published source value |
| 2025 SMB any token | 34% | Published source value |
| 2025 mid-market any token | 54% | Published source value |
| 2025 enterprise any token | 77% | Published source value |
| 2025 SMB network tokens | 26% | Published source value |
| 2025 enterprise network tokens | 56% | Published source value |
| 2025 enterprise gateway tokens | 58% | Published source value |
What changes when you compare the figures
| Comparison | Result | Calculation |
|---|---|---|
| 2025 both token types | 24% | = 44 + 40 - 60 |
| 2024 both token types | 25% | = 43 + 49 - 67 |
| 2025 network only | 20% | = 44 - 24 |
| 2025 gateway only | 16% | = 40 - 24 |
| 2024 network only | 18% | = 43 - 25 |
| 2024 gateway only | 24% | = 49 - 25 |
| Any token adoption change | -7 percentage points | = 60 - 67 |
| Enterprise versus SMB any-token gap | 43 percentage points | = 77 - 34 |
| Gateway-only adoption change | -8 percentage points | = 16 - 24 |
Methodology and sources
We read the weighted report values for the 2024 and 2025 payment-professional panels in Figure 17. Within a wave, we calculate the overlap as network share plus gateway share minus the reported net share. We then subtract the overlap from the marginal shares. The resulting exclusive shares are approximate because the source rounds percentages. Between-wave differences are descriptive. The survey does not track the same merchants or quantify the effect of tokenization on payment success.
Download the source data (CSV)
Download the calculations (CSV)
Download the citation notes (CSV)
Related reading
First-party misuse dispute evidence statistics for ecommerce merchants
Checkout payment statistics for wallets, cards and one-click checkout
Payment decline and retry statistics for online checkouts
Sources and definitions
MRC, Visa Acceptance Solutions and Verifi, 2025 Global eCommerce Payments & Fraud Report
The source data includes the population, period, denominator and limitations for every figure.