


Quick answer
In Checkout.com and Oxford Economics’ four-market survey, 45% of consumers said they would not retry after one false decline, and 42% said they would not return. Stripe separately reported a 60% year-on-year increase in Adaptive Acceptance retry success in 2024. These measure a shopper’s stated response and a provider’s operational outcome, respectively. At your store, measure eventual paid orders alongside attempts.
Checkout.com and Oxford Economics, High-Performance Payments · Stripe, AI enhancements to Adaptive Acceptance
Key findings and sources
Reported customer willingness to retry
In Checkout.com and Oxford Economics’ 2023 four-market research of 8,000 consumers overall, 45% said they would not retry after one false decline and 42% said they would not return. These were stated responses, with no observed retry behavior at individual checkouts.
Checkout.com and Oxford Economics, High-Performance Payments
Availability of failure details
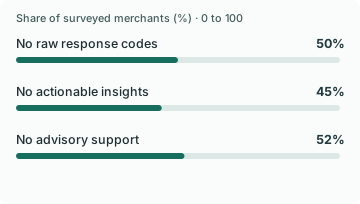
In the same four-market research, which included 1,500 enterprise businesses overall, 50% of merchants said they did not receive raw response codes and 45% said they received no actionable insights or analytics. These are separate survey questions.
Checkout.com and Oxford Economics, High-Performance Payments
Operational results from one provider
Stripe reported USD 6 billion recovered through Adaptive Acceptance in 2024 and a 60% year-over-year increase in retry success. The figures describe Stripe’s program and do not estimate a merchant’s expected lift.
Stripe, AI enhancements to Adaptive Acceptance
Attempt-level and eventual approval can diverge
Adyen illustrates the denominator difference with a transaction approved on its fourth attempt. The one order succeeds eventually, while one of four attempts was approved. This is an illustration, not a measured success rate.
The estimated size of false declines in four markets
Checkout.com and Oxford Economics’ 2023 research estimated USD 50.7 billion in false-decline losses in the US, UK, France and Germany. The amount is the research estimate, not transaction-level observed losses for all merchants.
Checkout.com and Oxford Economics, High-Performance Payments
A failed attempt and a decision to leave use separate survey questions
In Checkout.com and Oxford Economics’ four-market research, 45% of surveyed consumers said they would not retry after a single false decline and 42% said they would not return. These reported intentions differ by three points and do not establish overlap or observed customer loss.
Checkout.com and Oxford Economics, High-Performance Payments
A retry policy can be evaluated on incremental contribution per eligible decline
In Checkout Closer’s worked example, 100 extra attempts at $0.10 cost $10. One incremental order contributing $25 leaves $15 after that attempt cost, while two $5-contribution orders just cover it. Stripe’s report supplies provider context; the costs and margins are illustrative.
Stripe, AI enhancements to Adaptive Acceptance
The United States accounted for 83.63 percent of one four-market loss estimate
Checkout.com and Oxford Economics estimated US false-decline losses of $42.4 billion in 2022 out of $50.7 billion across the US, UK, France and Germany. The reconstructed US share of that four-market modeled total is 83.63%.
Checkout.com and Oxford Economics, High-Performance Payments
Provider-sponsored estimate for four specified markets and 2022; units are estimated lost sales dollars. Divide the published US estimate by the published four-market total.
The estimated business revenue impact differed by market
In the 2023 Checkout.com and Oxford Economics release, estimated false-decline loss was 2.1% of US business revenue, 1.3% in the UK and France, and 1.0% in Germany. The US-to-Germany difference was 1.1 percentage points.
Checkout.com and Oxford Economics, High-Performance Payments
Modeled 2022 loss share for the businesses covered by the four-market estimate. Subtract the German published loss share from the US share; retain country-specific revenue bases.
Compare the results
A decline creates two different questions
Forty-five percent of consumers in Checkout.com and Oxford Economics’ survey said they would not retry after one false decline. Forty-two percent said they would not return. Both answers tell you what respondents say they would do. They do not show how often the processor misidentified a legitimate payment or how many people would be recovered by another attempt. Someone may have more than one reason to stop, and the two responses may overlap.
At the point of failure, the store can see an attempted payment and its reported status. It might not yet know whether there is a valid, issuer-approved remedy. Keep the customer-facing reply grounded in that state. Confirm that the payment did not complete or that its status is still being checked. If a secure checkout can offer another legitimate method, point to it. Avoid language that diagnoses fraud, promises an eventual approval or asks for card details in chat.
A dashboard can improve when buyers have not
Adyen’s example shows why one success after three failed attempts produces a 100% eventual result for the one order and a 25% gross authorization result for its four attempts. Those percentages are both arithmetically true. One answers whether the transaction ultimately worked; the other shows the effort and retry costs behind the approval.
Give every payment attempt a durable parent checkout reference. Report first-attempt approvals, eventual paid checkouts and total attempts separately. If eventual approvals improve while attempts increase, buyers could be enduring a rougher path even as the total result looks better. If attempts decline and paid checkouts also decline, removing retries may have reduced recoverable volume. Reviewing both measurements makes these cases visible.
Match the number of authorized requests to the same outcome window. A shopper who completes through a different method after contacting support can still represent one eventual paid order. A delayed status change can also arrive after the immediate dashboard cut. Without a clear join and time window, the same shopper can be counted as lost in one system and converted in another.
For illustration, suppose 82 of 100 orders receive approval on the first attempt. Then 16 retry attempts recover 10 more orders. Your first-attempt rate is 82%, eventual paid-order rate is 92%, and gross approval is 92 of 116 attempts, or about 79%. Reporting those three figures together shows how many orders the retries recovered and how many total attempts the provider handled.
Choose a recovery action that the data can support
In the merchant survey, 50% said they did not receive raw response codes for failed payments and 45% said they received no actionable analytics or insight. Those are separate questions. A team with only generic failure reports may be able to improve the customer-facing message immediately. It cannot reliably sort the underlying causes without better processor detail.
Start with the failed payment states the provider documents for your setup. An incomplete authentication flow and a network decline can need different next steps. Some declines should not be retried and some recoveries require the shopper to take action in checkout. Follow the provider’s controls. In customer support, a trustworthy alternative route and a plain description of the current status can be more useful than another vague instruction to try again.
Treat provider outcomes as a comparison to investigate
Stripe reports that Adaptive Acceptance recovered USD 6 billion in falsely declined transactions in 2024 and that its retry success rate rose 60% year over year. It also reports a 35% reduction in retry attempts with its model improvements. These are provider-reported results from a particular system. They do not specify a conversion uplift a store can expect.
A merchant evaluating changes can compare a defined segment, such as returning customers reaching card authorization through the same flow, with a stable control. Count paid orders, time to recovery, attempts per paid checkout and any extra provider costs. A message change can improve customer comprehension without altering the issuer’s response. A provider-level routing change can alter approval without fixing a confusing error screen. Test each change against the decision it is meant to improve.
Keep the buyer’s reaction separate from the merchant’s diagnosis
Checkout.com and Oxford Economics reported two closely sized customer responses to a false decline: 45% said they would not retry and 42% said they would not return. The three-point gap does not tell us which respondents chose both answers. Nor does it tell a merchant that a failed retry caused a buyer to leave permanently. The study reports stated reactions in a four-market survey. A store needs its own order history and attempt events to distinguish the immediate loss from a later return.
The merchant side of the same study shows why the diagnosis can be slow. Seventy percent reported complex provider layering and half reported not receiving raw response codes, a 20-point gap between answers to different questions. Neither percentage identifies which merchants had both problems. Use the distinction to audit the information your support team actually sees, rather than assuming the payment provider can expose everything needed to help.
Create one event for the failed attempt and a separate record for the eventual order outcome. A shopper who pays on another eligible method is a recovered order, even if the first payment never succeeds. When the evidence does not distinguish a retryable issue from an unavailable method, a helpful reply can offer the next verified route without claiming to know why the issuer declined.
Put a contribution threshold on retry decisions
An attempt-level metric can improve while merchants get less value than expected. Stripe describes improved retry performance in its own Adaptive Acceptance deployment. A store deciding whether to expand retry eligibility can use a separate threshold calculation. Suppose a retry policy creates 100 extra paid attempts at an illustrative marginal cost of $0.10 each, and each incremental paid order contributes $25 after variable costs. It would need to recover at least one incremental order to clear the $10 attempt cost.
Consider a second case with lower order margin. If that same $10 in attempt cost buys incremental orders worth $5 in contribution each, two incremental orders are needed to break even. These examples hold the order value and attempt count fixed, which makes it easier to see how a policy that works for higher-margin carts can be a poor fit for another group. Include any support or payment costs that change with your actual method before comparing the groups.
Count newly paid orders relative to a holdout within the same eligible starting cohort. A customer who would have retried successfully without the policy can still appear as a recovered order in a provider report. A second attempt may also end in a duplicate paid order if order state is mishandled. Check final order state and reversals after a fixed follow-up, then compare incremental contribution and operational costs.
Where the estimate is concentrated changes how it should be quoted
Checkout.com and Oxford Economics attributed $42.4 billion of the $50.7 billion in estimated four-market 2022 false-decline losses to the United States. The US therefore represents 83.63% of that specific total, leaving about $8.3 billion across the UK, France and Germany combined. This is a reconstruction of the estimate’s geographic composition. It is neither a count of declined payments nor a worldwide share.
The same release estimates false-decline losses as a share of business revenue, where US businesses averaged 2.1%, UK and French businesses 1.3% each, and German businesses 1.0%. The US-to-Germany contrast is 1.1 percentage points. These ratios use business revenue bases, so they answer a different question from the market totals. Market size, covered enterprises, transaction mix and the estimation method all affect how much of the headline comes from one country. A small international store needs its own issuer and market breakdown before using any of these figures to size the work.
Separate an additional paid order from a second authorization attempt
Start with one order or payment intent, rather than counting each request as a new cart. Mark the first terminal decline, and separately keep unresolved attempts such as a browser timeout or a pending authentication. A later successful charge should be reconciled to that same order. If the customer completes on another payment method, count the order once and retain the method change as a diagnostic.
For the rollout decision, compare two groups of eligible declined orders with the same observation window. Count incremental paid orders after deducting processing and recovery costs. Stripe’s own provider report pairs a higher retry success rate with fewer attempts in a particular system; it supplies a reason to track both, without providing your store’s expected recovery rate. If status is unresolved, establish whether the previous payment completed before offering another attempt. If the issuer response is ineligible for retry, use an approved alternate payment path or clear next step and respect the processor’s rules.
Study data
| Measure | Value | Context |
|---|---|---|
| Consumers who said they would not retry a false decline | 45% | Survey response: 45% |
| Consumers who said they would not return after a false decline | 42% | Survey response: 42% |
| Merchants with complex provider layering | 70% | Survey response: 70% |
| Merchants not receiving raw response codes | 50% | Survey response: 50% |
| Merchants not receiving actionable insights or analytics | 45% | Survey response: 45% |
| Merchants not receiving advisory support | 52% | Survey response: 52% |
| Surveyed consumers | 8,000 consumers | 8,000 consumer respondents |
| Surveyed enterprise businesses | 1,500 businesses | 1,500 business respondents |
| False decline loss estimated across four markets | 50.7 billion USD | Estimated lost sales of USD 50.7 billion |
| US business global revenue loss from poor payment performance | 2.1% | Estimated average global revenue loss of 2.1% |
| Measure | Value | Context |
|---|---|---|
| Recovered transaction amount reported by Stripe | 6 billion USD | Stripe Adaptive Acceptance recovery reported for 2024 |
| Retry success rate change versus previous year | 60 % relative increase | Stripe’s year-on-year retry success rate change |
| Precision improvement for identifying false declines | 70 % relative increase | Precision gain claimed for new Adaptive Acceptance model |
| Change in retry attempts | 35 % relative decrease | Reduction in retry attempts reported by Stripe |
| Measure | Value | Context |
|---|---|---|
| Estimated US sales lost to false declines in 2022 | 42.4 USD billion | Published source value |
| Estimated UK business revenue share lost to false declines | 1.3% | Published source value |
| Estimated France business revenue share lost to false declines | 1.3% | Published source value |
| Estimated Germany business revenue share lost to false declines | 1% | Published source value |
What changes when you compare the figures
| Comparison | Result | Calculation |
|---|---|---|
| Merchant raw-code gap minus actionable-insight gap | 5 percentage points | = 50 - 45 |
| Merchant advisory support gap minus raw-code gap | 2 percentage points | = 52 - 50 |
| Stated no-retry response minus stated no-return response | 3 percentage points | = 45 - 42 |
| Complex provider layering minus lack of raw response codes | 20 percentage points | = 70 - 50 |
| Lack of advisory support minus lack of actionable insights | 7 percentage points | = 52 - 45 |
| Worked cost of 100 additional attempts at ten cents | $10.00 | = 100 * 0.10 |
| Worked net contribution from one extra order worth 25 dollars | $15.00 | = 25 - (100 * 0.10) |
| Worked break-even incremental orders at five dollars contribution | 2.0 orders | = (100 * 0.10) / 5 |
| US share of four-market modeled false-decline losses | 83.6292% | = 42.4 / 50.7 * 100 |
| Modeled losses across UK, France and Germany combined | 8.3 USD billion | = 50.7 - 42.4 |
| US versus Germany estimated revenue loss share | 1.1 percentage points | = 2.1 - 1 |
| US versus UK estimated revenue loss share | 0.8 percentage points | = 2.1 - 1.3 |
Methodology and sources
Reviewed the September 2023 Checkout.com release for survey scope, answers and the estimated loss. The four-market research included 8,000 consumers and 1,500 enterprise businesses. Merchant and consumer responses are kept separate. Vendor results come from Stripe’s Adaptive Acceptance announcement, with relative improvement and transaction amount retained in separate fields. The accounting example uses Adyen’s public distinction between net and gross authorization. Example events are illustrative. Cross-source figures are not treated as a single recovery funnel.
Download the source data (CSV)
Download the calculations (CSV)
Related reading
Checkout payment statistics for wallets, cards and one-click checkout
Buy now, pay later statistics for ecommerce checkouts
Sources and definitions
Checkout.com and Oxford Economics, High-Performance Payments research release
Stripe, AI enhancements to Adaptive Acceptance
The source data includes the population, period, denominator and limitations for every figure.